 Catalogue PIGMA
ESA/ESRIN > European Space Agency, European Space Research Institute, Frascati Italy
Type of resources
Topics
Keywords
Contact for the resource
Provided by
Years
Formats
Representation types
status
Resolution
-
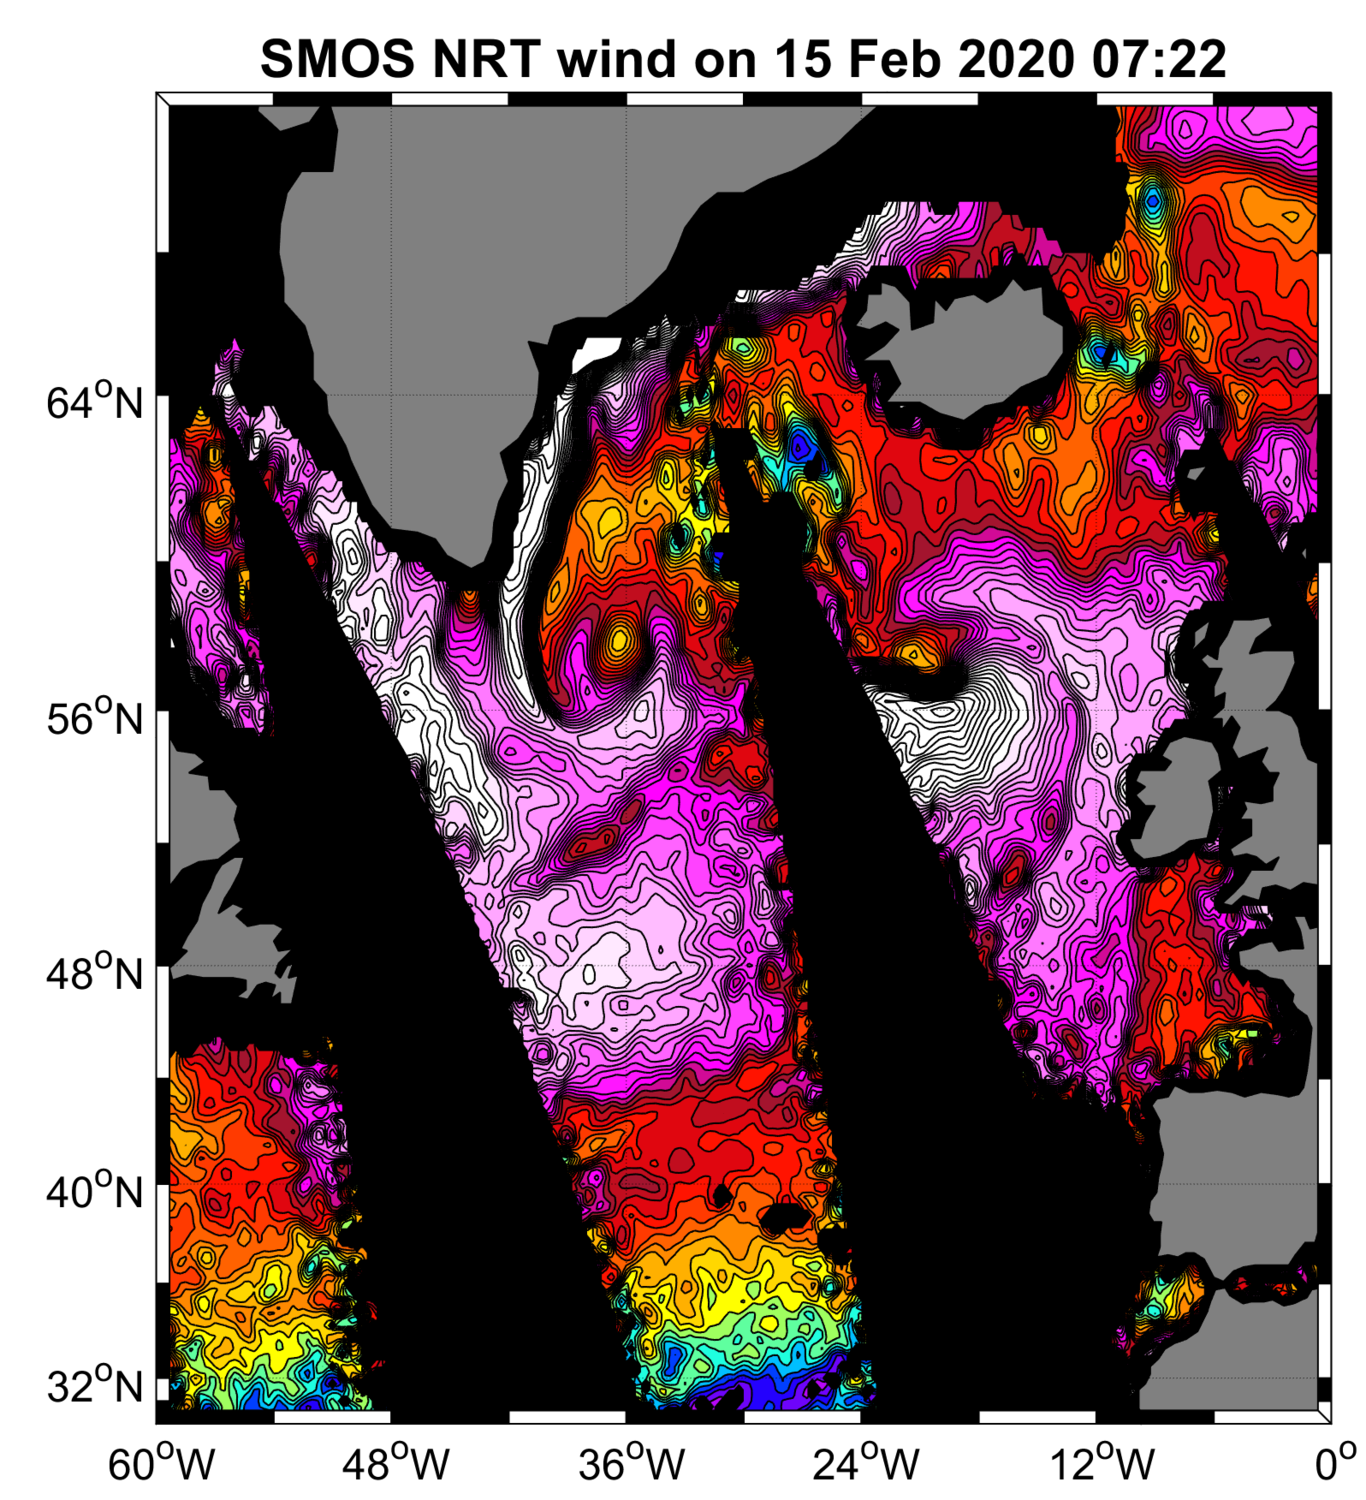
“SMOS Near Real Time Level 2 swath wind speed” (SMOS L2WS NRT) products, which are SMOS retrieved surface wind speed gridded maps with a spatial sampling of 1/4°x 1/4° and consisting of orbital segments (containing parts of ascending and descending half orbits) following the granularity of the SMOS Level 1B near real time (NRT) data products. SMOS L2WS NRT products are available within 4 to 6 hours from sensing and are generated in NetCDF-4 format as described in the "SMOS Wind Data Service Product Description Document" (http://www.smosstorm.org/Document-tools/SMOS-Wind-Data-Service-Documentation).
-
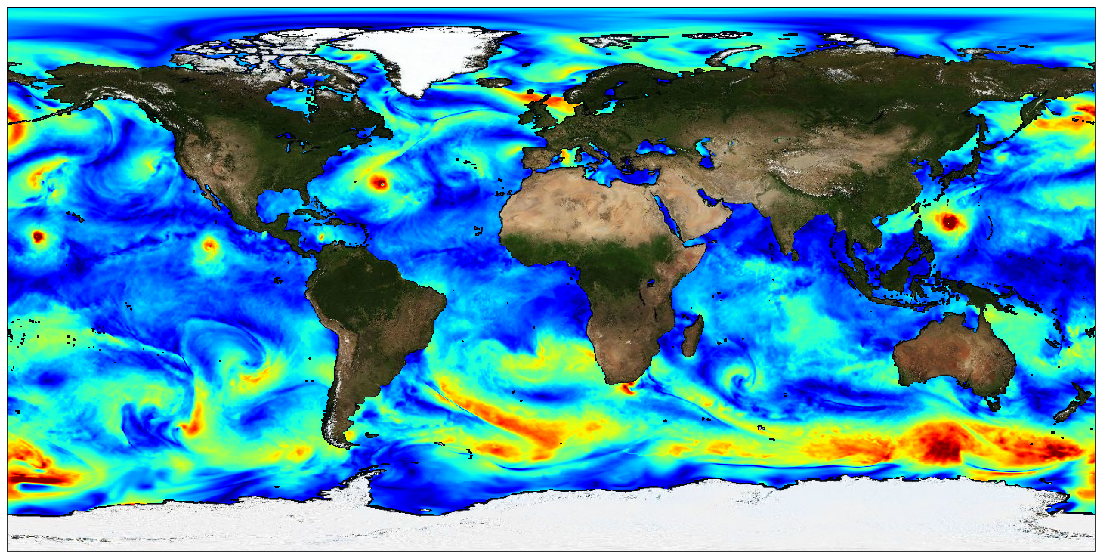
The Level 4 merged microwave wind product is a complete set of hourly global 10-m wind maps on a 0.25x0.25 degree latitude-longitude grid, spanning 1 Jan 2010 through the end of 2020. The product combines background neutral equivalent wind fields from ERA5, daily surface current fields from CMEMS, and stress equivalent winds obtained from several microwave passive and active sensors to produce hourly surface current relative stress equivalent wind analyses. The satellite winds include those from recently launched L-band passive sensors capable of measuring extreme winds in tropical cyclones, with little or no degradation from precipitation. All satellite winds used in the analyses have been recalibrated using a large set of collocated satellite-SFMR wind data in storm-centric coordinates. To maximize the use of the satellite microwave data, winds within a 24-hour window centered on the analysis time have been incorporated into each analysis. To accomodate the large time window, satellite wind speeds are transformed into deviations from ERA5 background wind speeds interpolated to the measurement times, and then an optical flow-based morphing technique is applied to these wind speed increments to propagate them from measurement to analysis time. These morphed wind speed increments are then added to the background wind speed at the analysis time to yield a set of total wind speeds fields for each sensor at the analysis time. These individual sensor wind speed fields are then combined with the background 10-m wind direction to yield vorticity and divergence fields for the individual sensor winds. From these, merged vorticity and divergence fields are computed as a weighted average of the individual vorticity and divergence fields. The final vector wind field is then obtained directly from these merged vorticity and divergence fields. Note that one consequence of producing the analyses in terms of vorticity and divergence is that there are no discontinuities in the wind speed fields at the (morphed) swath edges. There are two important points to be noted: the background ERA5 wind speed fields have been rescaled to be globally consistent with the recalibrated AMSR2 wind speeds. This rescaling involves a large increase in the ERA5 background winds beyond about 17 m/s. For example, an ERA5 10 m wind speed of 30 m/s is transformed into a wind speed of 41 m/s, and a wind speed of 34 m/s is transformed into a wind speed of about 48 m/s. Besides the current version of the product is calibrated for use within tropical cyclones and is not appropriate for use elsewhere. This dataset was produced in the frame of ESA MAXSS project. The primary objective of the ESA Marine Atmosphere eXtreme Satellite Synergy (MAXSS) project is to provide guidance and innovative methodologies to maximize the synergetic use of available Earth Observation data (satellite, in situ) to improve understanding about the multi-scale dynamical characteristics of extreme air-sea interaction.
-
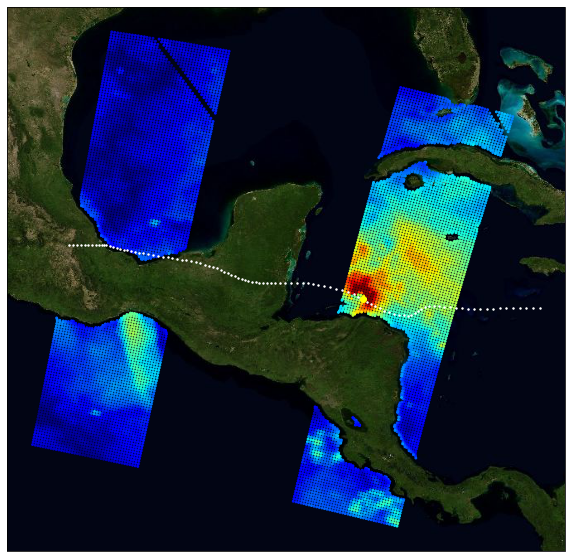
The primary objective of the ESA Marine Atmosphere eXtreme Satellite Synergy (MAXSS) project is to provide guidance and innovative methodologies to maximize the synergetic use of available Earth Observation data (satellite, in situ) to improve understanding about the multi-scale dynamical characteristics of extreme air-sea interaction. This dataset, produced in the frame of MAXSS project, provides multi-variate observations for Arctic polar lows (PL), for a selection of storm tracks extracted from Rojo et al (2019) during the period 2010-2018. The observations are taken from more than 35 satellite, numerical model and in situ sources, providing the inner and surface ocean conditions for a comprehensive range of parameters (sea surface height, surface winds, waves, precipitation, temperature, salinity, ocean colour, ...) before, during and after the storm passage. Different colocation radii and time windows are used depending on the parameter and observation dataset. The assembled data are stored in a standardized NetCDF4 file format and organised per basin, year, and storm name to ease data manipulation for users that are not used to work with this wealth of data.
-
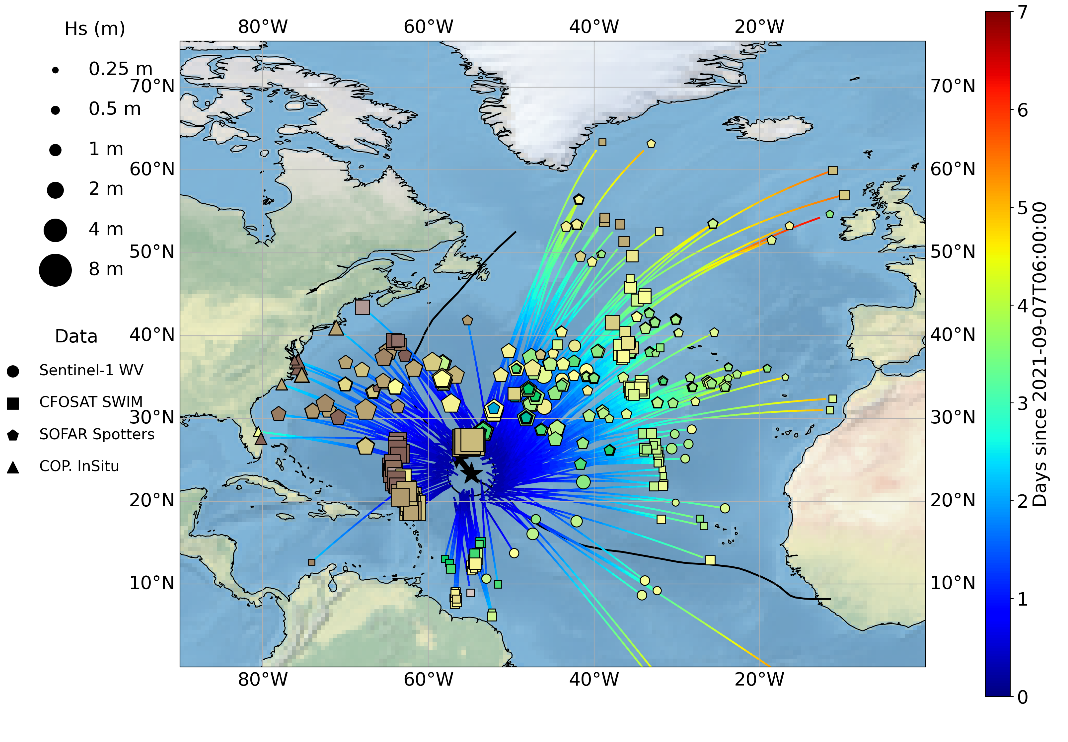
The main objectives of this dataset is to gather the ocean swells measured by different sensors, including satellite and in-situ sources, that were generated by a given tropical cyclone (TC). This dataset aims at providing characteristics of these swells such as their direction, wavelength (or period) and energy but also the date when they left the influence of the tropical cyclone wind to propagate freely. Wave spectra in tropical cyclones vary strongly per quadrant and provide information about the current and past state of the wave field. However, inside TCs, waves measurements including the wave system direction, energy and wavelength are rare and difficult to obtain with in-situ and remote sensing technics. For this dataset, both moored and drifting buoys are considered as long as they provide wave systems measurements. For the satellite contribution, Synthetic Aperture Radar (SAR) and real aperture radar (RAR) instruments can significantly contribute to the TC-generated waves documentation. Indeed, ocean wave spectra can be derived from modulations of the backscatter in SAR and RAR signal. SAR on board European satellite and in particular the SAR series developed since ERS-1 by ESA and now ESA/Copernicus with Sentinel-1 mission (S-1) are good candidates to provide these ocean waves systems characteristics thanks to the dedicated acquisition mode : the so-called Wave Mode. The wave spectrometer SWIM developed by the French space Agency (CNES) and embedded on the Chinese-French Oceanography SATellite (CFOSAT) has been launched more recently with a new measurement concept relying on a RAR and can certainly complement the S-1 data collection. Although the reasons are different, these two systems are limited for measuring waves generation area within the TC vortex where strong rain rates and wind regimes are observed. Far enough from their source, satellite acquisitions are thus expected to be able to observe these ocean swells during more favorable met-ocean conditions for waves retrieval inversion. As a consequence, our analysis is focused on waves originating from TC but that have been able to propagate far from their source. The analysis of swell measurements far from their area of generation to locate the storm source has been firstly applied to data from one single in-situ wave station (wave energy with frequency and direction) collected 2 miles off shore from San Clemente Island, California and extended to a network of several wave stations in the sixties. More recently, the gathering of swell system observed with SAR far from a storm to characterize the waves properties across the ocean has proven to be efficient in the case of extra-tropical storms. Yet, such analysis is not adapted to Tropical Cyclone whose size is much smaller and currently existing wave datasets do not allow for an accurate monitoring of the tropical cyclones swells. This multi-sensor Level-3 tropical cyclone waves dataset intends to fill this gap and opens for an alternate way of estimating tropical cyclone waves properties over all ocean basins and for all tropical cyclones. This dataset was produced in the frame of the ESA funded Marine Atmosphere eXtreme Satellite Synergy (MAXSS) project. The primary objective of the ESA Marine Atmosphere eXtreme Satellite Synergy (MAXSS) project is to provide guidance and innovative methodologies to maximize the synergetic use of available Earth Observation data (satellite, in situ) to improve understanding about the multi-scale dynamical characteristics of extreme air-sea interaction.